The Crohn’s Disease Inception Cohort.

Published

November 24, 2023

Introduction

Code
library(tidyverse)
library(ggdist)
library(datefixR)
library(patchwork)

if(!require(pander)) {
  install.packages("pander")
}

if(!require(viridis)) {
  install.packages("viridis")
}

if (!dir.exists("paper")) dir.create("paper")
if (!dir.exists("plots")) dir.create("plots")

options(knitr.table.format = "pipe")
FCcumulative <- read.csv(paste0("/Volumes/igmm/cvallejo-predicct/cdi/data/",
                                "20211201/FCcumulative.csv"))

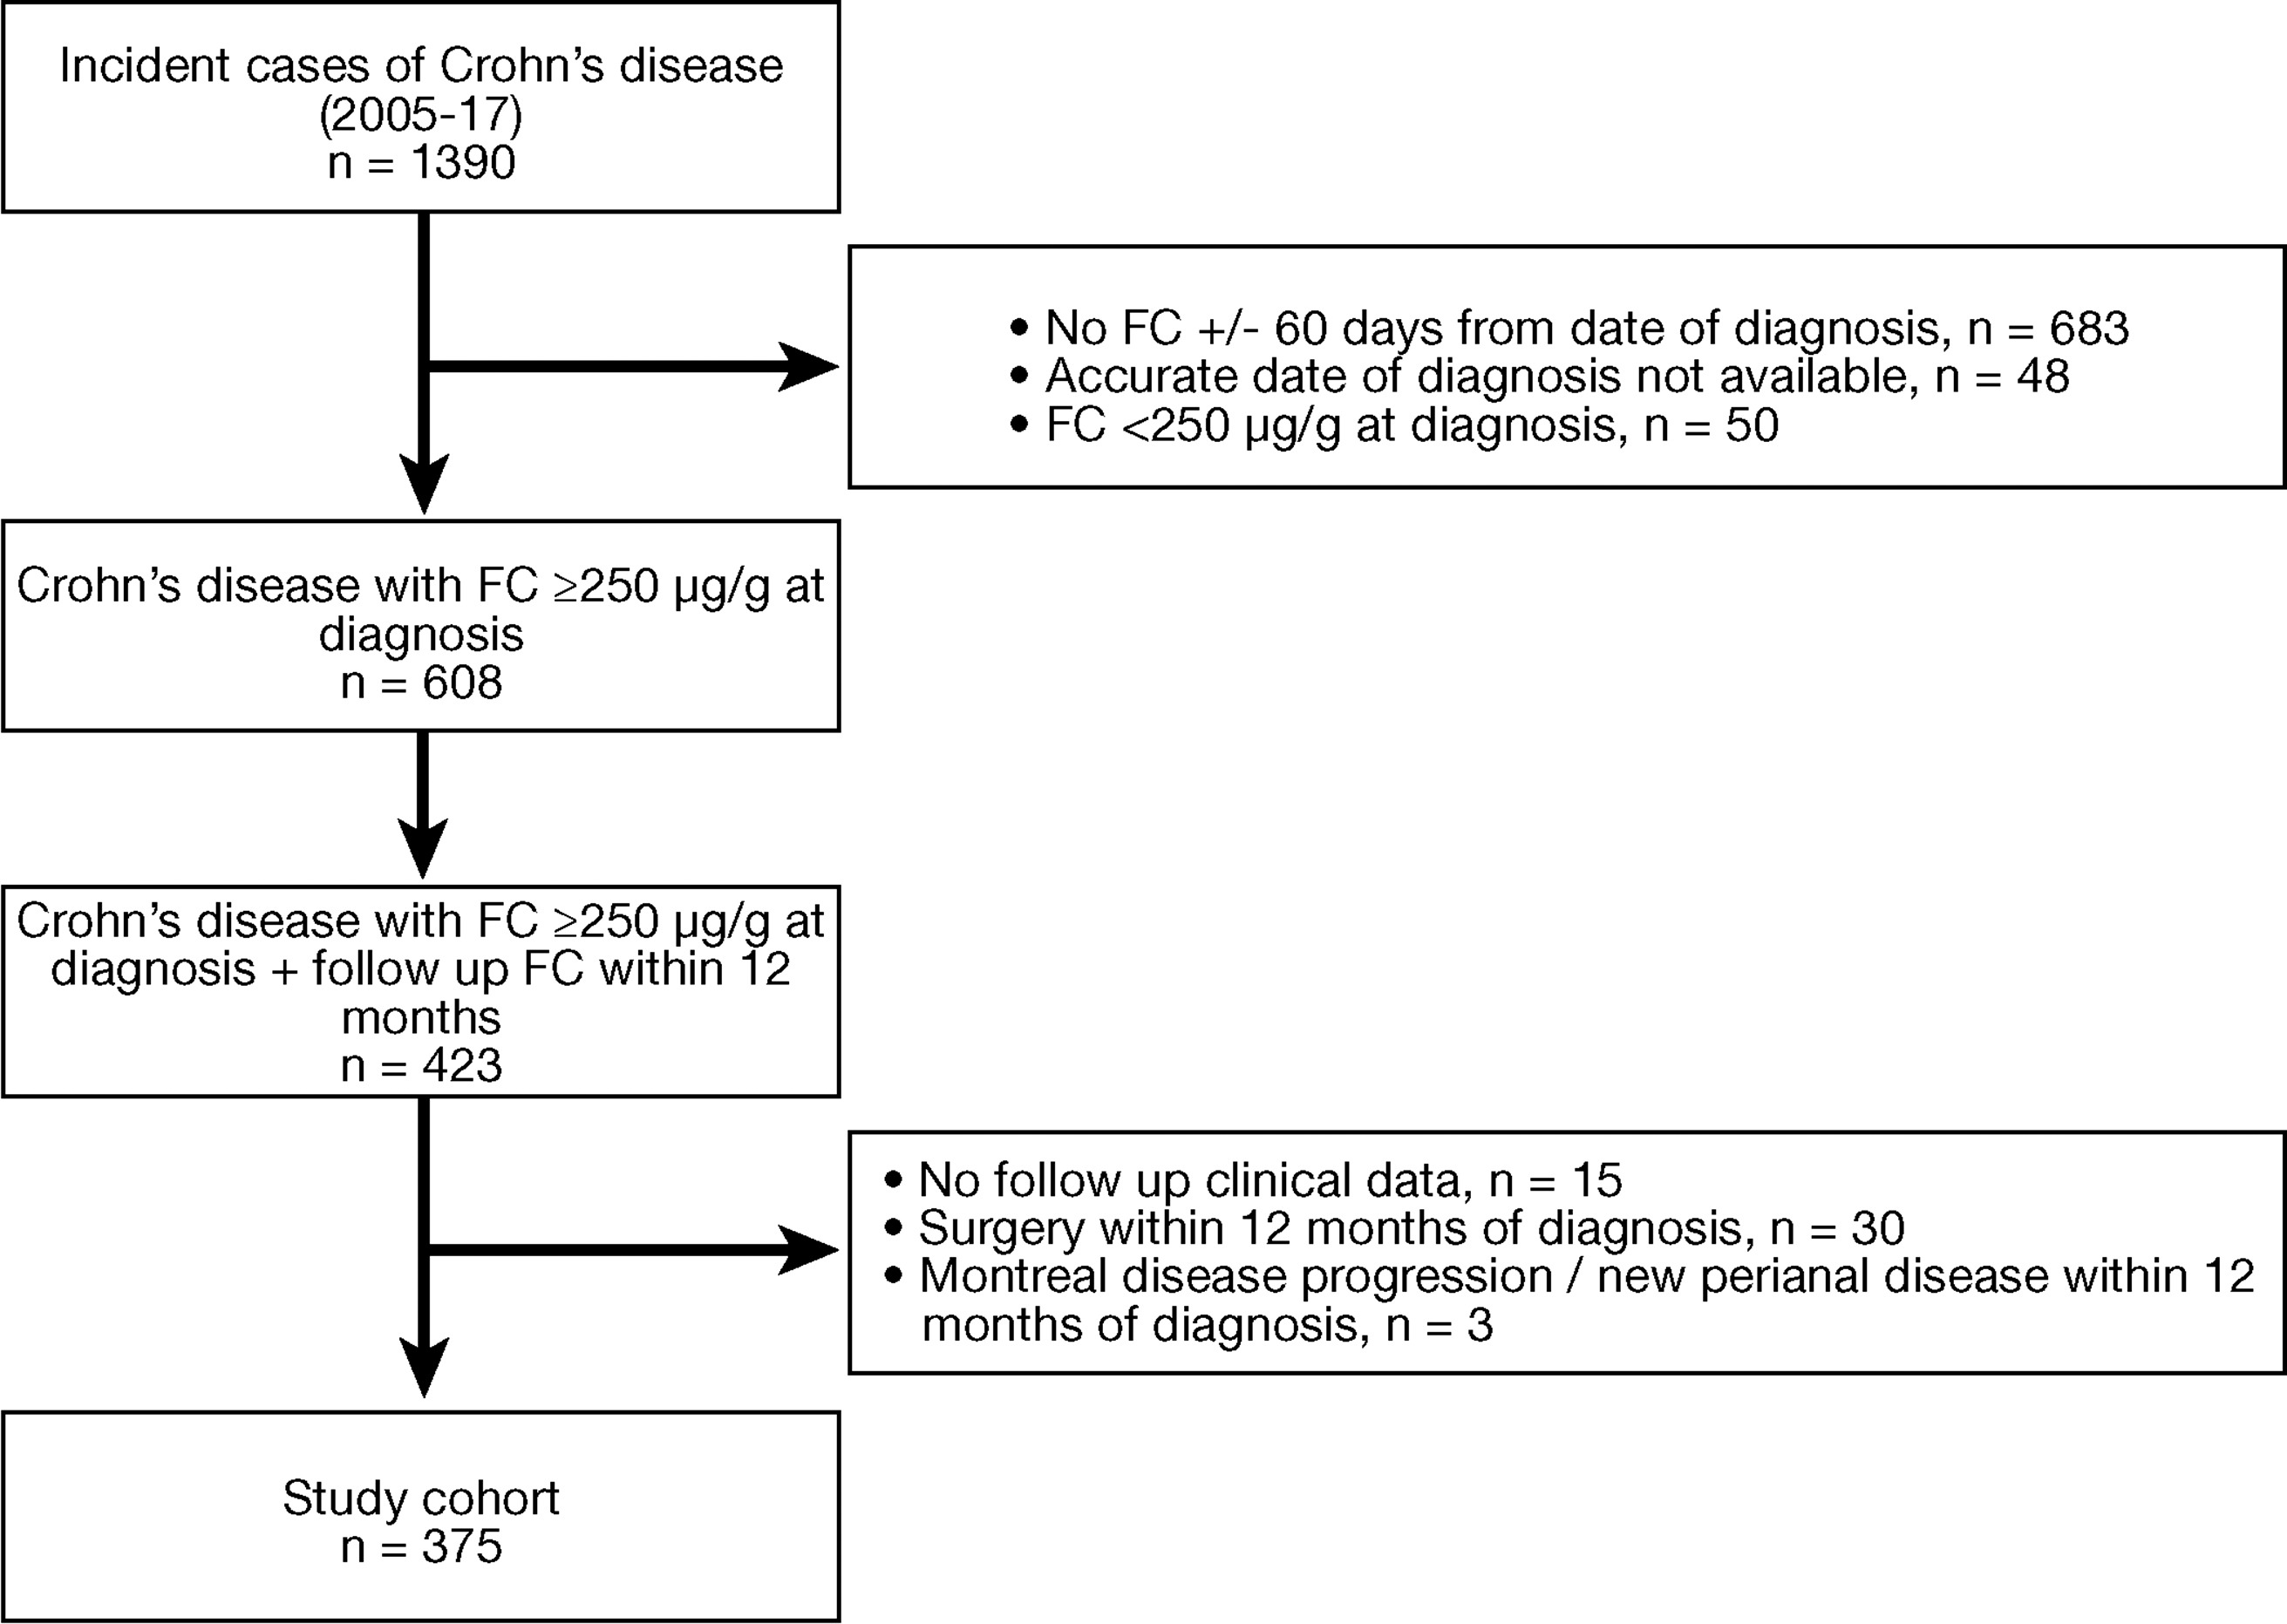
This analysis, which aims to find latent Crohn’s disease (CD) subgroups with similar faecal calprotectin (FCAL) profiles, uses data from the Crohn’s Disease Inception Cohort (Plevris et al. 2021). The Crohn’s disease inception cohort is a manually validated longitudinal cohort of 375 incident Crohn’s disease (CD) cases. These are all incident CD cases diagnosed between 2005 and 2017 with a diagnosis FCAL of \geq 250 \mu g/g, at least one FCAL measurement within the first 12 months of diagnosis, and at least 12 months of follow-up. Figure 1 shows how this cohort was derived.

Figure 1: Flowchart of how the Crohn’s disease inception cohort was derived (Plevris et al. 2021) (licensed under CC BY).

Previously, data from this cohort has been used by Plevris et al. (2021) to demonstrate an association between normalising (< 250 \mu g/g) FCAL within one year of diagnosis and CD disease outcomes. The outcomes considered were hospitalisation, surgery, disease behaviour progression, and a composite end-point of all three outcomes.

Plevris had begun formatting the relevant data into a relevant format for modelling of longitudinal and survival outcomes, but this process had not been completed before the data was transferred. This document details the data processing steps undertaken to facilitate modelling.

The data is currently in long format: one row per subject with one date column and one associated FCAL value per sample (see Table 1). As such, there are 375 rows in this dataset. This dataset has 147 columns in the dataset. There are up to 45 FCAL measurements with associated date columns, followed by censored status for each of the four outcomes and the associated dates. Some columns are entirely NA.

Code
knitr::kable(FCcumulative[1:5, 1:5], align = "c")
Table 1: First 5 rows and first 5 columns of the dataset.
X Patient.number FC1..DIAGNOSIS. FC1.DATE FC2
OVERALL 1 880 01/01/2015 770
OVERALL 2 1080 24/03/2017 142
OVERALL 3 410 01/01/2009 1215
OVERALL 4 400 14/06/2011 200
OVERALL 5 1650 17/11/2008 1920

Data wrangling

Dropping columns

The first column lists “Overall” for all subjects. This is believed to be a holdover from the original format of the data where each outcome for a subject had separate rows. As such, this column can be freely dropped. Additionally, all NA-only columns can also be dropped.

Furthermore, there are some unnamed columns which give the number of days between the diagnosis FCAL and the date of the FCAL measurement. These columns can also be dropped as they will be recalculated alongside all of the FCAL measurements which do not already have this statistic calculated.

Code
FCcumulative <- FCcumulative[, -1] %>% # drop first column
  select(function(x) !all(is.na(x))) %>% # drop all NA columns
  select(!starts_with("X")) # Drop columns giving days from diagnosis

Dropping these columns results in 102 columns being retained.

Converting to long format

For analysis, it is necessary to convert the data to long format: one row per measurement. fix_date_df() and fix_date_char() from the datefixR R package is used to convert the dates to R’s Date type. We also map censoring status indicators for endpoints to either 0 (censored) or 1 (observed).

Table 2 presents the first 5 rows of the long format table.

Code
ids <- c()
values <- c()
dates <- c()
hosps <- c()
date.hosps <- c()
progs <- c()
date.progs <- c()
surgs <- c()
date.surgs <- c()

composites <- c()
composites.days <- c()
composites.old <- c()
composites.days.old <- c()


for (subject in 1:nrow(FCcumulative)) {
  is.measurement <- TRUE
  measurement <- 0
  while (is.measurement & measurement < 45) {
    measurement <- measurement + 1
    value <- FCcumulative[subject, 2 * measurement]
    if (is.na(value)) {
      is.measurement <- FALSE
    } else {
    date <- FCcumulative[subject, (2 * measurement) + 1]
    
    hosp <- FCcumulative[subject, "IBD.HOSPITALISATION.POST.1.YEAR..Y.N."]
    if (hosp == "Y") hosp <- 1
    if (hosp == "N") hosp <- 0
    if (hosp == "N ") hosp <- 0
    date.hosp <- FCcumulative[subject, "DATE.OF.FIRST.IBD.HOSPITALISATION.POST.1.YEAR"]
    if (date.hosp == "N" | date.hosp == "NO") {
      date.hosp <- FCcumulative[subject, "DATE.OF.LAST.FOLLOW.UP"]
    } 
    
    prog <- FCcumulative[subject, "DISEASE.PROGRESSION.POST.1.YEAR..Y.N...B1.B2.3..B2.B3.new.perianal."]
    if (prog == "Y") prog <- 1
    if (prog == "N") prog <- 0
    
    date.prog <- FCcumulative[subject, "DATE.OF.DISEASE.PROGRESSION.POST.1.YEAR"]
    if (date.prog == "N" | date.prog == "NO") {
      date.prog <- FCcumulative[subject, "DATE.OF.LAST.FOLLOW.UP"]
    }
    
    surg <- FCcumulative[subject, "RESECTIONAL.SURGERY.POST.1.YEAR..Y.N."]
    if (surg == "Y") surg <- 1
    if (surg == "y") surg <- 1
    if (surg == "N") surg <- 0
    if (surg == "NO") surg <- 0

    date.surg <- FCcumulative[subject, "DATE.OF.FIRST.SURGERY.POST.1.YEAR"]
    if (date.surg == "N" | date.surg == "NO") {
      date.surg <- FCcumulative[subject, "DATE.OF.LAST.FOLLOW.UP"]
    }
    

    composite  <-  ifelse(hosp | prog | surg, 1, 0)
    composite.day <- min(fix_date_char(c(date.hosp,
                                         date.prog,
                                         date.surg)))

    composite.old  <- FCcumulative[subject, "COMPOSITE.CENSOR"]
    composite.day.old <- FCcumulative[subject, "COMPOSITE.DAYS"]
    
    ids <- c(ids, subject); values <- c(values, value); dates <- c(dates, date)
    hosps <- c(hosps, hosp); date.hosps <- c(date.hosps, date.hosp)
    progs <- c(progs, prog); date.progs <- c(date.progs, date.prog)
    surgs <- c(surgs, surg); date.surgs <- c(date.surgs, date.surg)
    composites <- c(composites, composite)
    composites.days <- c(composites.days, composite.day)
    composites.old <- c(composites.old, composite.old)
    composites.days.old <- c(composites.days.old, composite.day.old)
    }
  }
}

FCcumulativeLong <- data.frame(id = ids,
                               date = dates, 
                               value = values,
                               hosp = hosps,
                               hosp.date = date.hosps,
                               prog = progs,
                               prog.date = date.progs,
                               surg = surgs,
                               surg.date = date.surgs,
                               composite = composites,
                               composites.day = composites.days,
                               comp.old = composites.old,
                               comp.day.old = composites.days.old)

FCcumulativeLong <- fix_date_df(FCcumulativeLong,
                              c("date",
                                "hosp.date",
                                "prog.date",
                                "surg.date"))

FCcumulativeLong$composites.day <- as.Date(FCcumulativeLong$composites.day,
                                           origin = "1970-01-01")

FCcounts <- as.vector(table(FCcumulativeLong$id))

max.followup <- max(c(FCcumulativeLong$hosp.date,
                      FCcumulativeLong$prog.date,
                      FCcumulativeLong$surg.date))

knitr::kable(FCcumulativeLong[1:5, 1:3], align = "c")
Table 2: First 5 observations of the long-format table.
id date value
1 2015-01-01 880
1 2015-06-09 770
1 2016-10-28 90
2 2017-03-24 1080
2 2017-07-04 142

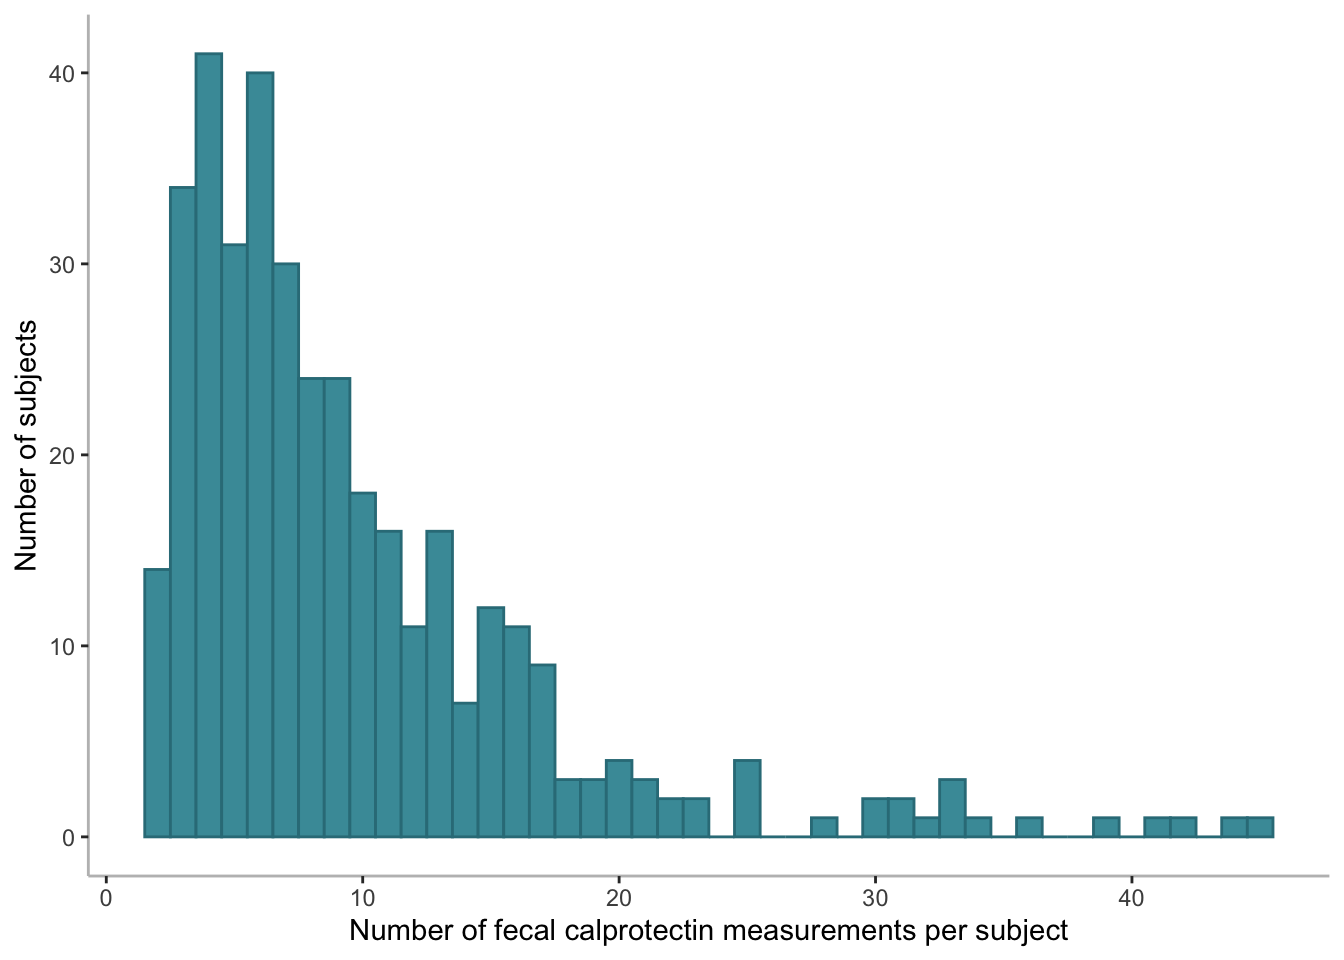
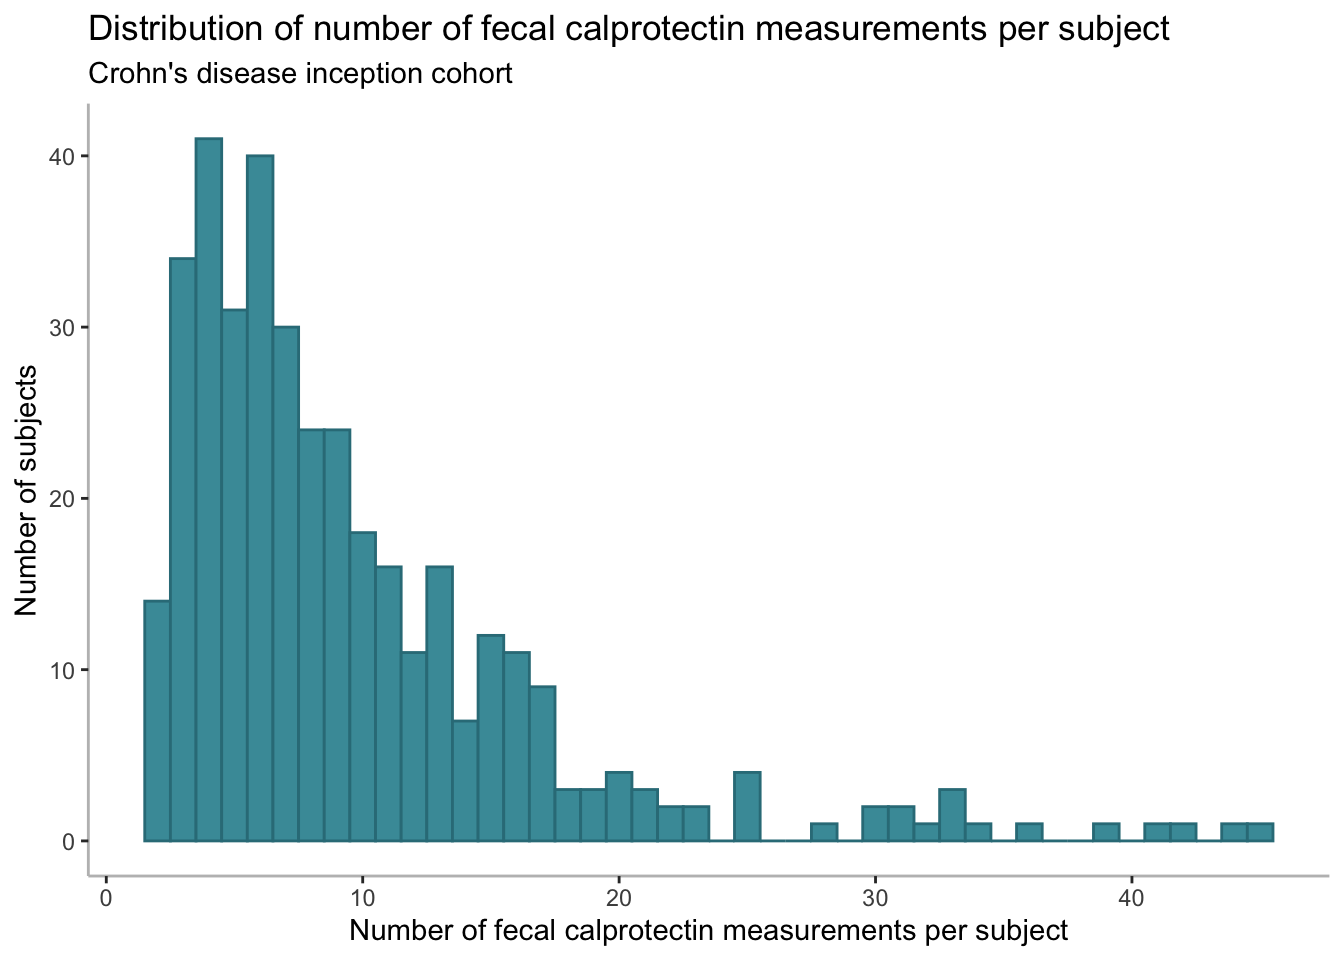
Converting to long format reveals there are 3616 FCAL samples reported in this dataset with mean 9.64 measurements per subject and median 7 (Q1: 5, Q3: 12) measurements per subject. From these quantiles, it appears the distribution of number of FCAL measurements is highly skewed. Figure 2 shows this distribution in greater detail and demonstrates the substantial skew observed.

Code
FCcountsdf <- tibble(counts = FCcounts)

p <- FCcountsdf %>%
  ggplot(aes(x = counts)) +
  geom_histogram(binwidth = 1, fill = "#479AA7", col = "#327c88") +
  theme_classic() +
  theme(axis.line = element_line(colour = "gray")) +
  ggtitle(paste("Distribution of number of fecal calprotectin measurements",
                "per subject"), 
          "Crohn's disease inception cohort") +
  xlab("Number of fecal calprotectin measurements per subject") +
  ylab("Number of subjects")
p

Figure 2: Distribution of the number of FCAL measurements per subject for the Crohn’s disease inception cohort.

Quality control

Code
largeFC <- subset(FCcumulativeLong, value > 2500)

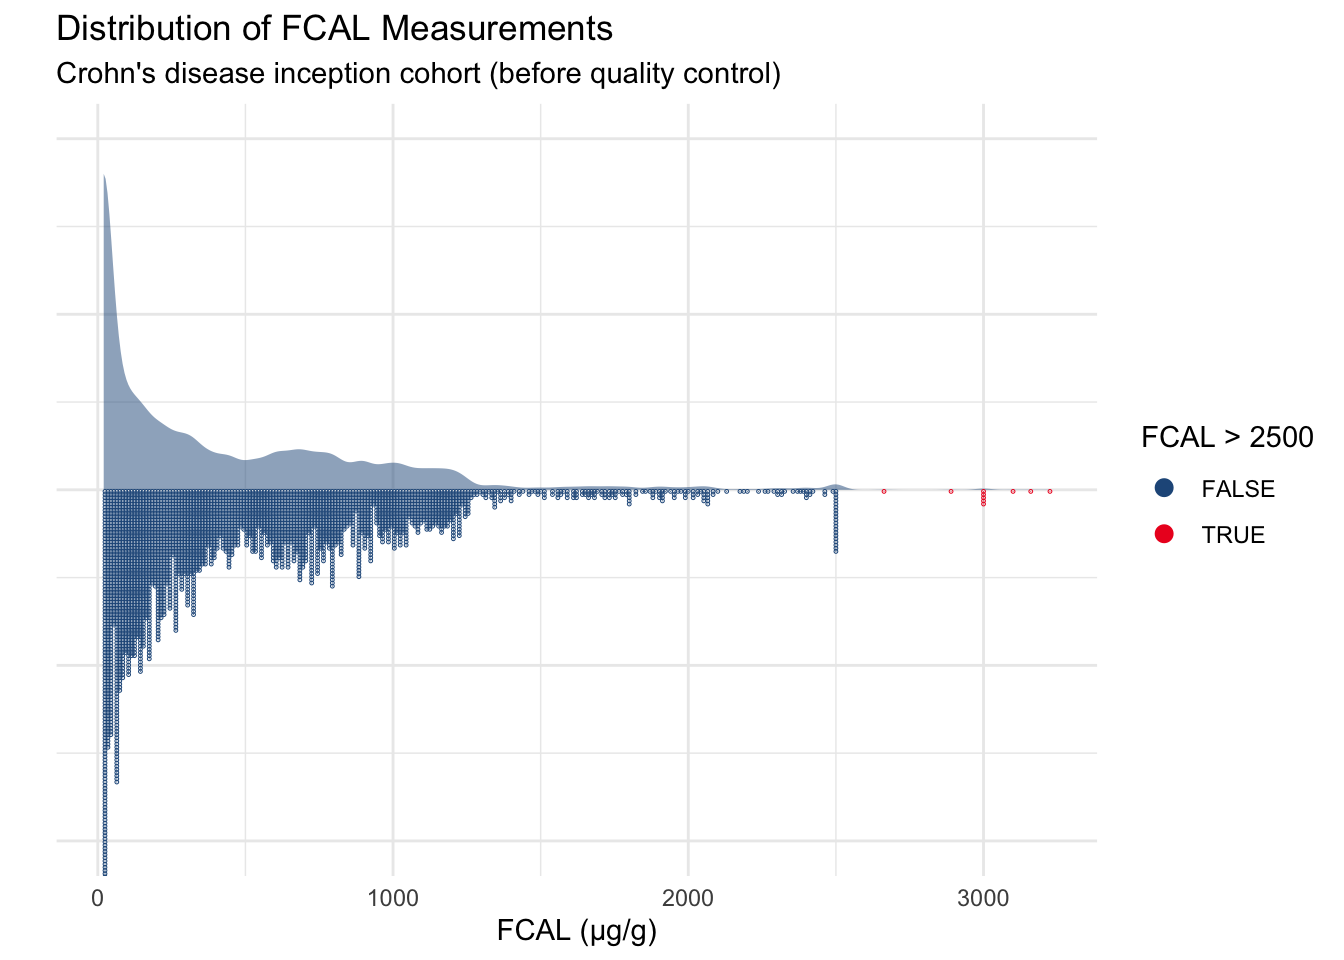
From Figure 3, we can see there are FCAL measurements greater than 2500 \mu g/g despite the assay used by NHS Lothian having an upper accuracy limit of 2500 with values greater than this normally reported as “> 2500”. There are 10 measurements which are above this threshold.

Code
FCcumulativeLong %>%
  ggplot(aes(x = value, y = NULL)) +
  stat_slab(size = 0.8, alpha = 0.5, fill = "#235789") +
  geom_dots(aes(color = value > 2500, fill = value > 2500),
            binwidth = 10,
            size = 1,
            side = "bottom") +
  theme_minimal() +
  theme(axis.text.y = element_blank()) +
  xlab("FCAL (µg/g)") +
  ylab("") +
  ggtitle("Distribution of FCAL Measurements",
          "Crohn's disease inception cohort (before quality control)") +
  scale_fill_manual(values = c("#235789", "#ed1c24")) + 
  scale_color_manual(values = c("#235789", "#ed1c24")) +
  labs(fill = "FCAL > 2500", color = "FCAL > 2500")

Figure 3: Distribution of FCAL values. Red dots indicate FCAL values above 2500.

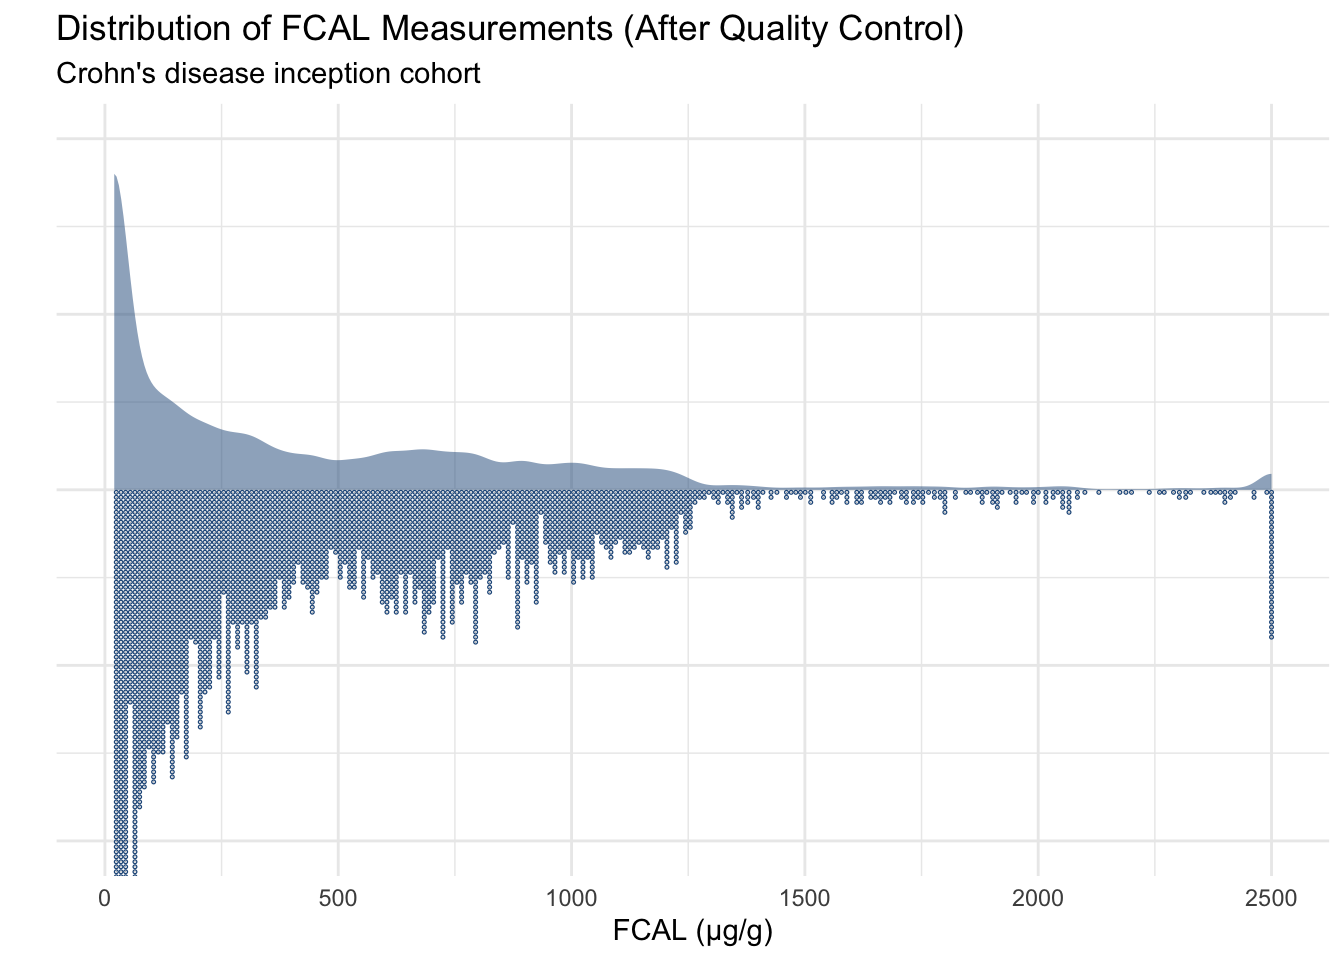
FCAL > 2500 has been mapped to FCAL = 2500 which results in the distribution seen in Figure 4.

Code
FCcumulativeLong$value <- ifelse(FCcumulativeLong$value > 2500,
                           2500,
                           FCcumulativeLong$value)

FCcumulativeLong %>%
  ggplot(aes(x = value, y = NULL)) +
  stat_slab(size = 0.8, alpha = 0.5, fill = "#235789") +
  geom_dots(binwidth = 10, size = 1, side = "bottom", color = "#235789") +
  theme_minimal() +
  theme(axis.text.y = element_blank()) +
  xlab("FCAL (µg/g)") +
  ylab("") +
  ggtitle("Distribution of FCAL Measurements (After Quality Control)",
          "Crohn's disease inception cohort")

Figure 4: Distribution of FCAL values once values above 2500 are mapped to 2500.

Time retiming

We will create a new variable, time, which will give the number of days since the subject’s diagnostic FCAL for each FCAL measurement. It follows time = 0 for each subject’s diagnostic measurement. time has been scaled to be on a year-scale. Table 3 presents the first 10 FCAL observations.

Code
tempdf <- data.frame()

for (subject in seq_along(FCcumulative$Patient.number)) {
  temp <- subset(FCcumulativeLong, id == subject)
  # Should already be in order, but worth ensuring
  temp <- temp[order(temp$date), ]
  temp$time <- as.numeric(temp$date - temp$date[1]) / 365.25
  temp$hosp.date <- as.numeric(temp$hosp.date - temp$date[1]) / 365.25
  temp$prog.date <- as.numeric(temp$prog.date - temp$date[1]) / 365.25
  temp$surg.date <- as.numeric(temp$surg.date - temp$date[1]) / 365.25
  temp$composites.day <- as.numeric(temp$composites.day - temp$date[1]) / 365.25
  tempdf <- rbind(tempdf, temp)
}

FCcumulativeLong <- tempdf
rm(tempdf)

knitr::kable(FCcumulativeLong[1:10, c(1, 2, 3, 12)], row.names = FALSE)
Table 3: FCAL measurements with time since diagnosis.
id date value comp.old
1 2015-01-01 880 1
1 2015-06-09 770 1
1 2016-10-28 90 1
2 2017-03-24 1080 1
2 2017-07-04 142 1
2 2018-03-22 363 1
2 2018-06-26 376 1
2 2018-10-02 1210 1
3 2009-01-01 410 1
3 2009-05-12 1215 1

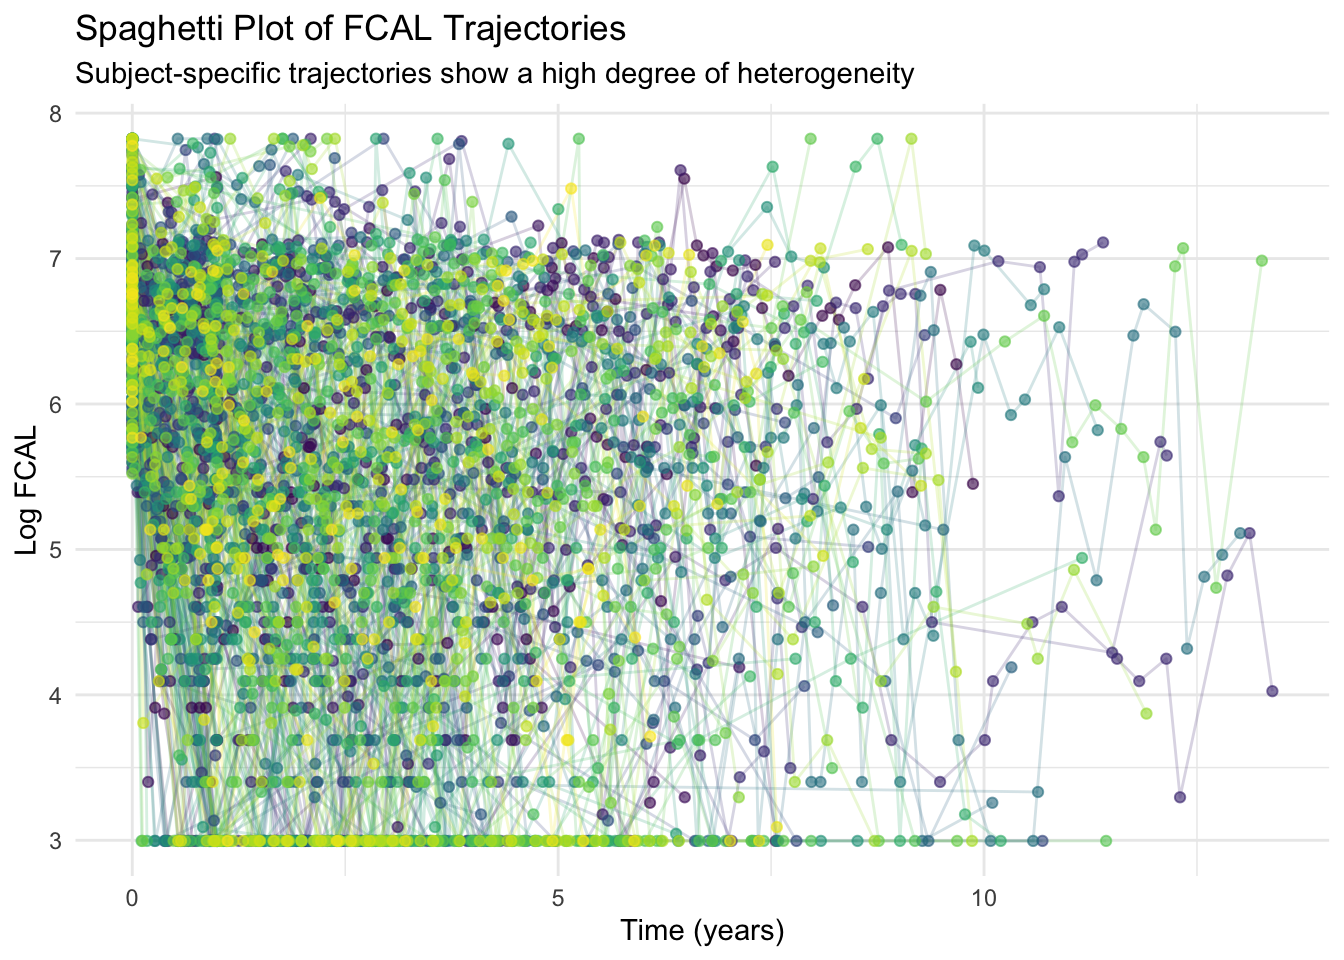
From these data, we are able to plot subject-specific FCAL trajectories. As expected, a high degree of heterogeneity is observed (Figure 5).

Code
FCcumulativeLong %>% 
  ggplot(aes(x = time, y = log(value), color = factor(id))) +
  geom_line(alpha = 0.2) +
  geom_point(alpha = 0.6) +
  theme_minimal() + 
  scale_color_manual(values = viridis::viridis(375)) +
  guides(color = "none") +
  xlab("Time (years)") +
  ylab("Log FCAL") +
  ggtitle("Spaghetti Plot of FCAL Trajectories",
          "Subject-specific trajectories show a high degree of heterogeneity")

Figure 5: Spaghetti plot of all FCAL trajectories in the Crohn’s disease inception cohort.

Time cut-off

As a sparse number of measurements at the end of the follow-up may result in a longitudinal model performing poorly for this time-period, a cut-off for time should be mandated. As such, we have performed an exploratory analysis to inform our decision on the value for this cut-off (Table 4). At least three measurements in the eligible time period have been mandated for a subject to be included.

Code
years <- seq(2, 10)
mean.n <- c()
median.n <- c()
IQR.n <- c()

for (year in years) {
  # restrict to measurements within threshold
  temp <- subset(FCcumulativeLong, time <= year) 
  # restrict to subjects with three measurements within threshold
  temp <- subset(temp, id %in% (unique(temp$id))[table(temp$id) > 3])
  counts <- table(temp$id)
  mean.n <- c(mean.n, round(mean(counts), 2))
  median.n <- c(median.n, median(counts))
  IQR.n <- c(IQR.n,  IQR(counts))
}

knitr::kable(data.frame(years = years,
                     mean.n = mean.n,
                     median.n = median.n,
                     IQR.n = IQR.n),
             col.names = c("Year cut-off", "Mean", "Median", "IQR"))
Table 4: Mean, median and interquartile range for number of FCAL measurements per subject for different time cut-offs.
Year cut-off Mean Median IQR
2 5.72 5 2
3 6.83 6 3
4 7.79 7 5
5 8.64 7 5
6 9.30 8 5
7 9.82 8 6
8 10.16 8 7
9 10.36 8 7
10 10.50 8 7

From this table, measurements within six years of diagnosis seems a sensible cut-off. However, we have ultimately decided five years is a better choice in order to be able to directly compare with other studies, for example the IBSEN study (Henriksen et al. 2007), which describe 5-year disease activity trajectories.

Based on the data cleaning step of the pipeline, restricting measurements to within 5 years of diagnosis seemed appropriate. Additionally, we will only consider subjects with at least 3 FCAL measurements within this time period. This report reports descriptive statistics for the cohort after this inclusion criteria is applied.

Code
FCcumulativeLong <- subset(FCcumulativeLong, time < 5)
subjects.with.3 <- unique(FCcumulativeLong$id)[table(FCcumulativeLong$id) >=3]
FCcumulativeLong <- subset(FCcumulativeLong, id %in% subjects.with.3)
FCcounts <- as.vector(table(FCcumulativeLong$id))

There are 356 CDI subjects which meet the criteria of having at least 3 FCAL measurements within 5 years of diagnosis.

There are 2856 FCAL samples reported with mean 8.02 measurements per subject and median 7 (Q1: 5, Q3: 10) measurements per subject. The below plots are updated version of previous plots: updated to only include subjects which meet these criteria.

Code
p <- FCcountsdf %>%
  ggplot(aes(x = counts)) +
  geom_histogram(binwidth = 1, fill = "#479AA7", col = "#327c88") +
  theme_classic() +
  theme(axis.line = element_line(colour = "gray")) +
  xlab("Number of fecal calprotectin measurements per subject") +
  ylab("Number of subjects")
ggsave("paper/fcal-freq-dist.pdf", p, width = 8, height = 4.5, units = "in")
p

Figure 6: Distribution of number of FCAL measurements per subject after applying cut-off

Code
p1 <- ggplot(FCcumulativeLong, aes(x = value)) +
  geom_histogram(aes(y = ..density..),
                 fill = "#D8829D",
                 color = "#AF6A80",
                 bins = 30) +
  geom_density(color = "#023777", size = 1.2) +
  theme_classic() +
  theme(axis.line = element_line(colour = "gray")) +
  ylab("Density") +
  xlab("Fecal calprotectin (μg/g)") + ggtitle("A")
Warning: Using `size` aesthetic for lines was deprecated in ggplot2 3.4.0.
ℹ Please use `linewidth` instead.
Code
p2 <- ggplot(FCcumulativeLong, aes(x = log(value))) +
  geom_histogram(aes(y = ..density..),
                 fill = "#D8829D",
                 color = "#AF6A80",
                 bins = 30) +
  geom_density(color = "#023777", size = 1.2) +
  theme_classic() +
  theme(axis.line = element_line(colour = "gray")) +
  ylab("Density") +
  xlab("Log Fecal calprotectin (FCAL (μg/g))") + ggtitle("B")
cairo_pdf("plots/Dist-comp.pdf", width = 8, height = 4.5)
p1 + p2
Warning: The dot-dot notation (`..density..`) was deprecated in ggplot2 3.4.0.
ℹ Please use `after_stat(density)` instead.
Code
invisible(dev.off())
print(p1 + p2)

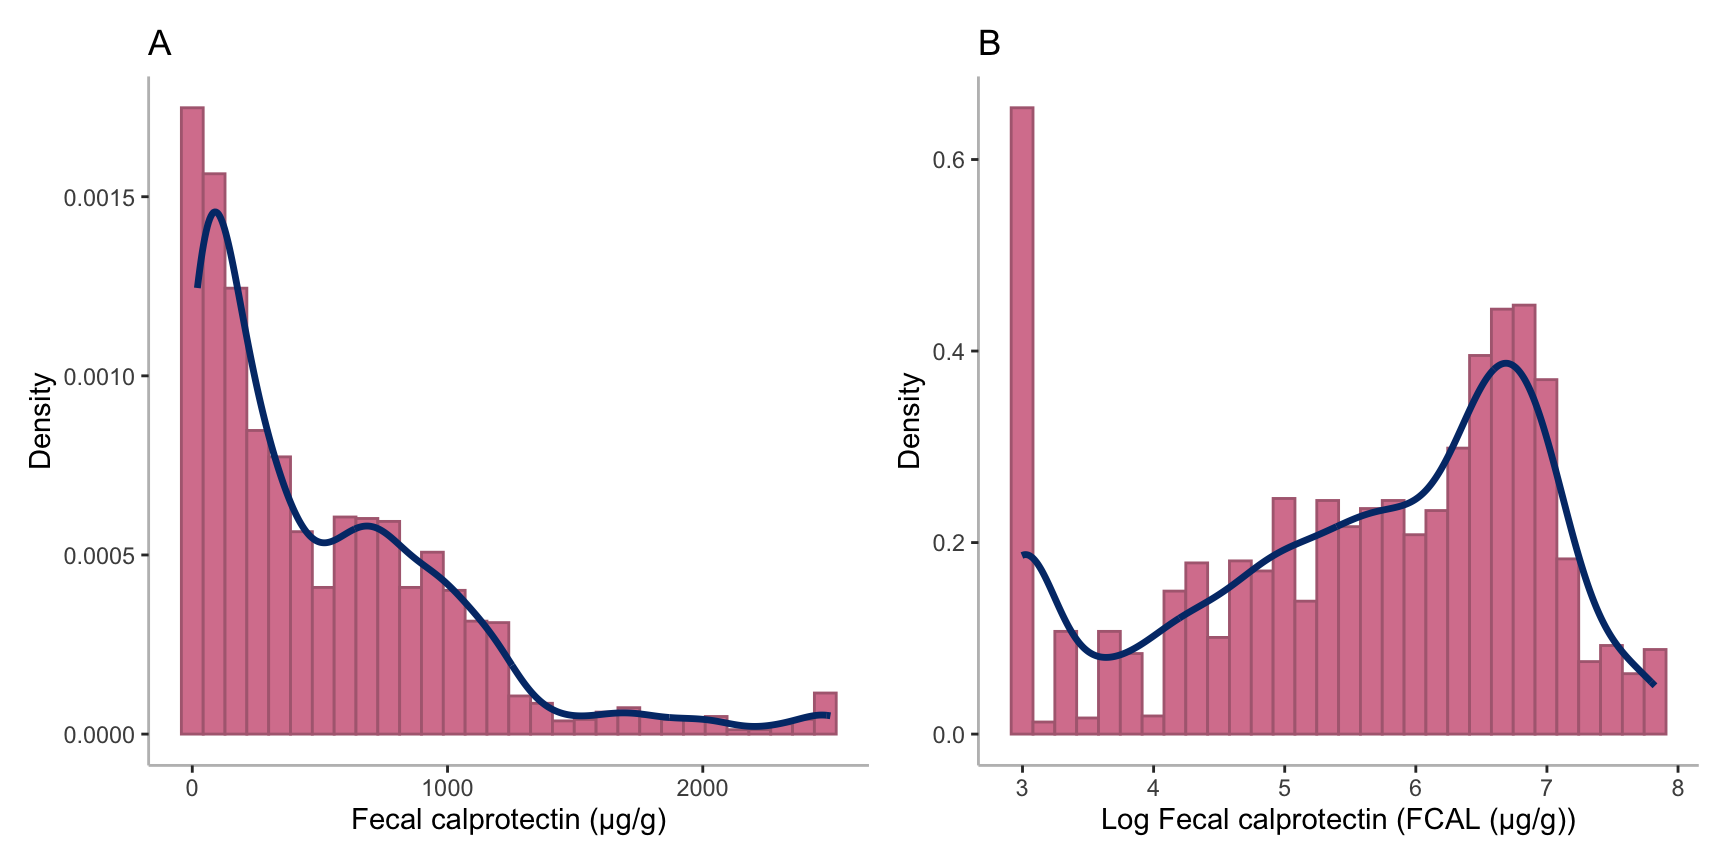
Figure 7: Distribution of FCAL after applying the cut-off in (A) natural scale; and (B) log scale.

Code
cairo_pdf("plots/spaghetti-all.pdf", width = 8, height = 4.5)
FCcumulativeLong %>% 
  ggplot(aes(x = time, y = log(value), color = factor(id))) +
  geom_line(alpha = 0.2) +
  geom_point(alpha = 0.6) +
  theme_minimal() + 
  scale_color_manual(values = viridis::viridis(375)) +
  guides(color = "none") +
  xlab("Time (years)") +
  ylab("Log (FCAL (μg/g))")
invisible(dev.off())

It should be noted June 2019 is the last month of follow-up.

Data saving

The tidied data, with a 5-year cut-off applied, has been saved as a RDS file for the model selection step of the analysis pipeline.

Code
saveRDS(FCcumulativeLong,
        paste0("/Volumes/igmm/cvallejo-predicct/cdi/processed/",
               "FCcumulativeLongInc.RDS"))

Session information

R version 4.3.2 (2023-10-31)

Platform: aarch64-apple-darwin20 (64-bit)

locale: en_GB.UTF-8||en_GB.UTF-8||en_GB.UTF-8||C||en_GB.UTF-8||en_GB.UTF-8

attached base packages: stats, graphics, grDevices, utils, datasets, methods and base

other attached packages: viridis(v.0.6.4), viridisLite(v.0.4.2), pander(v.0.6.5), patchwork(v.1.1.3), datefixR(v.1.6.0.9000), ggdist(v.3.3.0), lubridate(v.1.9.3), forcats(v.1.0.0), stringr(v.1.5.1), dplyr(v.1.1.4), purrr(v.1.0.2), readr(v.2.1.4), tidyr(v.1.3.0), tibble(v.3.2.1), ggplot2(v.3.4.4) and tidyverse(v.2.0.0)

loaded via a namespace (and not attached): rappdirs(v.0.3.3), utf8(v.1.2.4), generics(v.0.1.3), xml2(v.1.3.5), stringi(v.1.8.1), hms(v.1.1.3), digest(v.0.6.33), magrittr(v.2.0.3), evaluate(v.0.23), grid(v.4.3.2), timechange(v.0.2.0), fastmap(v.1.1.1), jsonlite(v.1.8.7), gridExtra(v.2.3), httr(v.1.4.7), rvest(v.1.0.3), fansi(v.1.0.5), scales(v.1.2.1), textshaping(v.0.3.7), httr2(v.1.0.0), cli(v.3.6.1), rlang(v.1.1.2), munsell(v.0.5.0), withr(v.2.5.2), yaml(v.2.3.7), tools(v.4.3.2), tzdb(v.0.4.0), colorspace(v.2.1-0), vctrs(v.0.6.4), R6(v.2.5.1), lifecycle(v.1.0.4), htmlwidgets(v.1.6.3), clisymbols(v.1.2.0), ragg(v.1.2.6), pkgconfig(v.2.0.3), pillar(v.1.9.0), gtable(v.0.3.4), Rcpp(v.1.0.11), glue(v.1.6.2), systemfonts(v.1.0.5), xfun(v.0.41), tidyselect(v.1.2.0), knitr(v.1.45), farver(v.2.1.1), htmltools(v.0.5.7), labeling(v.0.4.3), rmarkdown(v.2.25), compiler(v.4.3.2), quadprog(v.1.5-8) and distributional(v.0.3.2)
MRC Human Genetics Unit logoCentre for Genomic & Experimental Medicine logo

Acknowledgments

This work is funded by the Medical Research Council & University of Edinburgh via a Precision Medicine PhD studentship (MR/N013166/1, to NC-C).

Author contributions

NC-C performed the data cleaning detailed in this report. NP extracted the data from electronic health records and formatted the data in the format initially described. KM-G and CAV provided supervisory support and assisted with revisions.

Reuse

Licensed by CC BY except for the MRC Human Genetics Unit, The University of Edinburgh, and Centre for Genomic & Experimental Medicine logos or unless otherwise stated.

References

Henriksen, Magne, Jørgen Jahnsen, Idar Lygren, Erling Aadland, Tom Schulz, Morten H. Vatn, Bjørn Moum, and THE IBSEN STUDY GROUP. 2007. “Clinical Course in Crohns Disease: Results of a Five-Year Population-Based Follow-up Study (the IBSEN Study).” Scandinavian Journal of Gastroenterology 42 (5): 602–10. https://doi.org/10.1080/00365520601076124.
Plevris, Nikolas, James Fulforth, Mathew Lyons, Spyros I. Siakavellas, Philip W. Jenkinson, Cher S. Chuah, Laura Lucaciu, et al. 2021. “Normalization of Fecal Calprotectin Within 12 Months of Diagnosis Is Associated with Reduced Risk of Disease Progression in Patients with Crohn’s Disease.” Clinical Gastroenterology and Hepatology 19 (9): 1835–1844.e6. https://doi.org/10.1016/j.cgh.2020.08.022.

Citation

BibTeX citation:
@article{constantine-cooke2023,
  author = {Nathan Constantine-Cooke and Karla Monterrubio-Gómez and
    Nikolas Plevris and Lauranne A.A.P. Derikx and Beatriz Gros and
    Gareth-Rhys Jones and Riccardo E. Marioni and Charlie W. Lees and
    Catalina A. Vallejos},
  publisher = {Elsevier},
  title = {Longitudinal {Fecal} {Calprotectin} {Profiles} {Characterize}
    {Disease} {Course} {Heterogeneity} in {Crohn’s} {Disease}},
  journal = {Clinical Gastroenterology and Hepatology},
  date = {2023-11-24},
  url = {https://www.cghjournal.org/article/S1542-3565(23)00234-3/},
  doi = {10.1016/j.cgh.2023.03.026},
  issn = {1542-3565},
  langid = {en}
}
For attribution, please cite this work as:
Nathan Constantine-Cooke, Karla Monterrubio-Gómez, Nikolas Plevris, Lauranne A.A.P. Derikx, Beatriz Gros, Gareth-Rhys Jones, Riccardo E. Marioni, Charlie W. Lees, and Catalina A. Vallejos. 2023. “Longitudinal Fecal Calprotectin Profiles Characterize Disease Course Heterogeneity in Crohn’s Disease.” Clinical Gastroenterology and Hepatology, November. https://doi.org/10.1016/j.cgh.2023.03.026.